
12 Free Resources to Learn Data Analysis Without Paying for a Course
Disclosure: Some of the links in this post are affiliate links. This means if you click on the link and purchase an item, I will receive an affiliate commission at no extra cost to you.
Learning data analysis can feel expensive, especially when every other tutorial seems to lead toward another paid course. However, starting does not require a large budget. Plenty of free resources can introduce statistics, spreadsheets, SQL, Python, visualization, and practical data projects.
The bigger challenge involves choosing resources that actually help build useful skills. Watching random videos can create information overload, while jumping between platforms can make progress difficult to measure. A better approach starts with a simple learning path and focuses on practice alongside theory.
For beginners, Excel and Google Sheets provide an accessible starting point. Statistics also matters because numbers become much easier to interpret once the basic concepts make sense. From there, SQL, Python, dashboards, and real datasets can gradually expand the toolkit.
Practical work matters just as much as lessons. A small sales report, customer survey analysis, or trend dashboard can demonstrate stronger ability than a collection of unfinished courses. Therefore, each learning resource should lead toward something tangible.
FreeCodeCamp, Kaggle, Microsoft Learn, Khan Academy, DataCamp, Coursera audit options, and other educational platforms can provide useful starting points. Some resources focus on technical skills, while others strengthen analytical thinking and problem-solving.
The best part involves starting with what already fits the available setup. A phone, Google Sheets, YouTube, and free datasets can support meaningful practice.
Anyone exploring profitable digital careers can also explore 5 Lucrative Remote Skills You Can Learn in 2026 for more ideas.
12 Free Resources to Learn Data Analysis Without Paying for a Course
1. Kaggle Learn
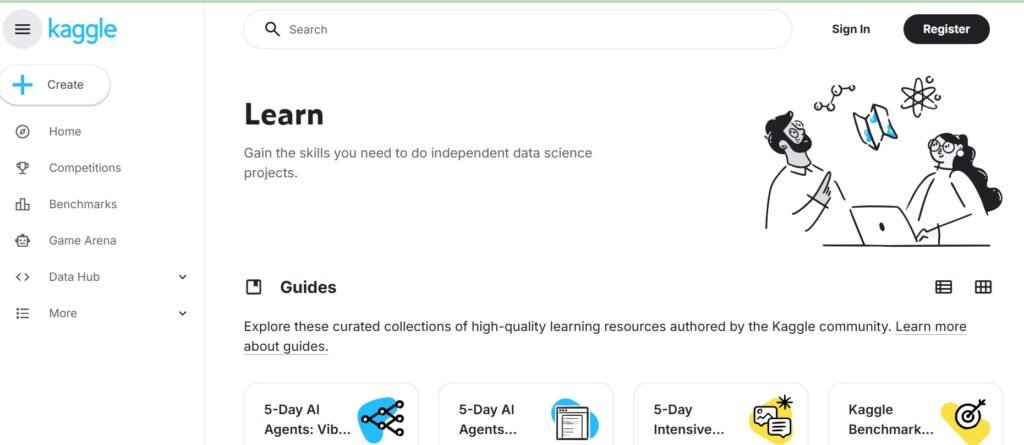
Kaggle makes a strong starting point for anyone who wants to learn data analysis through practical work. The platform combines lessons, datasets, notebooks, and community projects, so theory does not have to stay theoretical.
The beginner-friendly courses cover topics such as Python, pandas, data visualization, and introductory machine learning. More importantly, Kaggle gives learners access to real datasets that can turn practice sessions into portfolio material.
A useful strategy involves choosing one beginner course and completing every exercise instead of jumping between several topics. After that, download a dataset and recreate a small analysis from scratch.
For example, a sales dataset could support a project that identifies the best-selling products, monthly trends, and revenue changes. A customer dataset could reveal purchasing patterns or common customer groups. That approach creates evidence of practical ability.
Someone interested in building a broader digital career can also explore 5 Lucrative Remote Skills You Can Learn in 2026 alongside data skills.
Kaggle also helps learners become comfortable working with messy information. Real datasets rarely look perfect, so cleaning and organizing data becomes an important part of the learning process.
Start with simple questions. Then inspect the data. Clean obvious errors. Create useful calculations. Build a visual summary. Finally, explain what the numbers mean. That final explanation separates a basic spreadsheet user from someone developing genuine analytical thinking.
2. freeCodeCamp
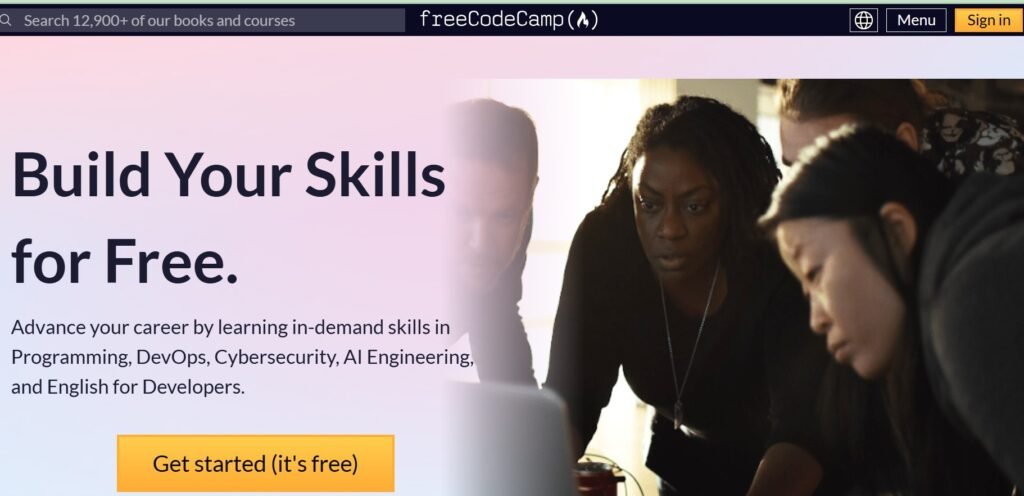
freeCodeCamp offers a large collection of free technical learning materials, including resources that can support a data analysis journey. Python, databases, statistics, and programming fundamentals can all contribute to stronger analytical skills.
The biggest advantage comes from hands-on practice.
Instead of watching a lesson and moving on, complete the exercises and projects attached to the topic. Practice creates familiarity with syntax, logic, and problem-solving. SQL deserves special attention.
Businesses store enormous amounts of information inside databases, and analysts often need SQL to retrieve and organize that information. Learning queries such as SELECT, WHERE, GROUP BY, ORDER BY, and JOIN can create a useful foundation.
Python can then expand the toolkit further. Libraries such as pandas can help clean and manipulate datasets. Visualization libraries can turn numbers into understandable charts.
FreeCodeCamp also offers structured learning paths, which can help prevent random study sessions. Learners who need extra support with technology can also check 10 APPS That Teach Tech Skills for FREE. The important thing involves progress rather than speed. One completed project teaches more than ten unfinished tutorials.
3. Google Data Analytics on Coursera
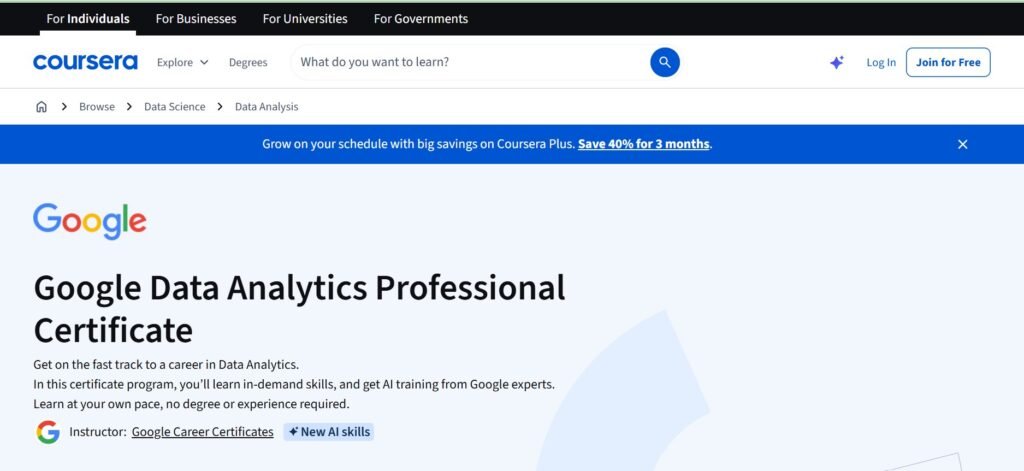
The Google Data Analytics Professional Certificate offers a structured path through the data analysis process. The program covers concepts connected with spreadsheets, SQL, data cleaning, visualization, and analytical thinking.
For learners using Coursera, audit availability can vary by course and platform setup. Check the current enrollment options before starting. The structure can help people who struggle with deciding what to study next.
A typical workflow moves through questions, data preparation, analysis, visualization, and communication. That sequence mirrors how many real analytical projects work.
The project-based approach also makes it easier to understand why each skill matters. Excel is not simply a spreadsheet tool. It can help organize and inspect information. SQL is not just code. It can retrieve the exact data needed for a business question. Data visualization also becomes more meaningful when it supports a clear conclusion.
Learners preparing for remote opportunities can strengthen their broader job-search strategy with 8 Powerful AI Prompts You Can Use for Job Search. A structured curriculum can also help reduce the temptation to jump between unrelated tutorials.
4. Microsoft Learn
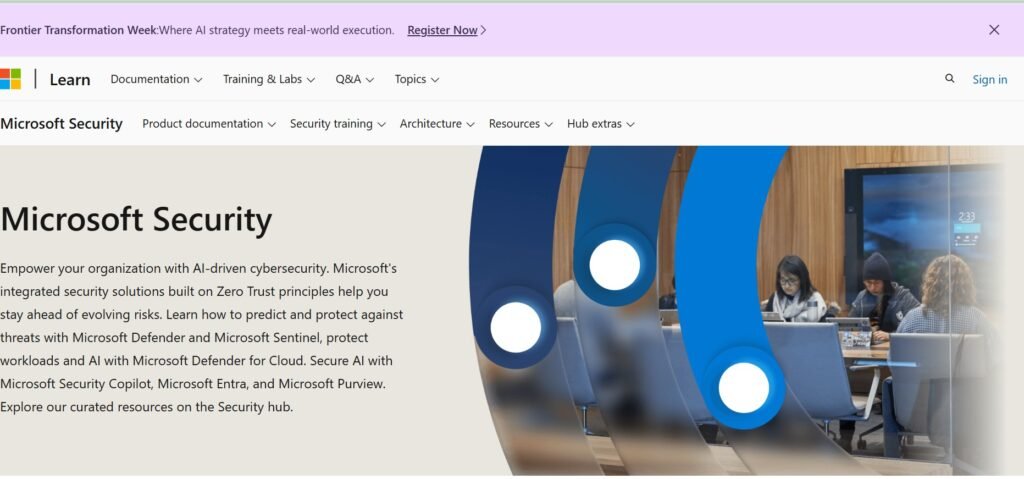
Microsoft Learn provides official training resources for Excel, Power BI, data concepts, and other Microsoft technologies. Excel remains a practical skill for beginners because it provides an accessible environment for working with rows, columns, formulas, filters, and summaries.
Power BI can take that foundation further by introducing dashboards and interactive reporting. Start with basic Excel functions.
Then move into sorting, filtering, conditional formatting, pivot tables, and charts. After gaining confidence, explore Power Query and Power BI when the learning path starts to feel comfortable. The advantage of Microsoft Learn involves structured modules and official documentation.
That makes it useful for people who prefer guided learning instead of random videos. The platform also helps learners become familiar with tools that businesses often use.
Anyone strengthening spreadsheet skills can supplement this resource with 9 Websites That Teach You EXCEL Courses for FREE.
A strong beginner project could involve analyzing monthly sales. Create a dataset. Clean duplicate entries. Calculate revenue. Compare monthly performance. Then build a simple dashboard. That one project can reinforce several concepts at once.
5. Harvard Online Learning
Harvard offers online learning resources that can strengthen the mathematical and statistical side of data analysis. Statistics matters because data analysis involves more than creating attractive charts. A chart can display information. Statistical thinking helps determine what that information actually means. Probability, distributions, correlation, averages, and variability become especially useful when analyzing business or customer data.
Beginners sometimes avoid statistics because the subject looks intimidating. Start with the fundamentals. Understand averages. Learn percentages. Study distributions. Then explore concepts such as standard deviation and correlation. Once those ideas make sense, analytical tasks become easier to interpret.
This foundation can also improve SQL and Python learning later. Learners can use data-related examples from business, marketing, finance, or customer research to make abstract ideas easier to understand.
Professionals building broader digital skills can explore 10 Skills AI Can’t Replace That You Should Be Learning while developing analytical abilities. The goal does not involve becoming a statistician. The goal involves understanding enough statistics to make better decisions with data.
6. MIT OpenCourseWare
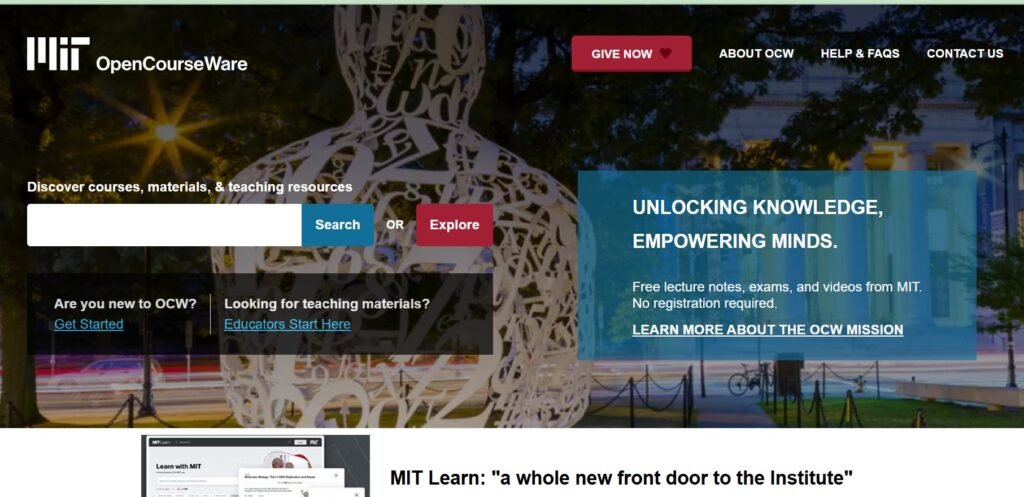
MIT OpenCourseWare provides university-level materials that can deepen understanding for learners who want more challenging concepts. This resource works best after the basics feel comfortable.
Statistics, probability, mathematics, and computer science materials can strengthen analytical thinking. The biggest benefit involves depth.
Rather than focusing only on which software button to click, learners can explore why analytical methods work. That difference matters for long-term growth.
For example, someone who understands the reasoning behind probability can interpret patterns more carefully. A person who understands algorithms can approach larger analytical problems with greater confidence.
MIT material can also encourage independent learning. Read the lecture notes and watch available lectures, then complete exercises and apply the concepts to a real dataset.
A learner who wants more free resources for technical subjects can also explore 20 FREE Resources to Learn Cybersecurity and compare learning approaches across digital fields. MIT OpenCourseWare can feel demanding, so begin with selected topics rather than trying to complete an entire course immediately.
7. Khan Academy

Khan Academy offers approachable lessons in mathematics, statistics, and probability. This makes it especially useful for beginners who may feel uncomfortable working with numbers. Strong analytical skills often begin with building confidence in basic mathematical concepts.
Percentages can help you compare performance, while ratios reveal relationships between different values. Probability helps you understand uncertainty, and statistics provides useful ways to summarise large amounts of information. Khan Academy breaks these concepts into smaller lessons, making them easier to understand and study consistently.
A practical approach is to connect each mathematical concept to a real dataset. After learning about averages, for example, calculate the average sales for a specific period. Once you understand percentages, use them to compare month-over-month growth. After studying probability, explore patterns in customer behaviour.
This approach keeps the learning process connected to real-world problems. It also makes mathematical concepts easier to remember and prevents mathematics from feeling like an isolated subject.
Learners developing more professional skills can explore 8 Skills to Aggressively Learn and Focus on If You Are in Your 30s for additional career-development ideas. The numbers become much less intimidating once they connect to meaningful questions.
8. Codecademy

Downturned eyes often look beautiful with a lifted classic lash map. Keep the inner lashes short, then build moderate length towards the centre before gradually tapering the outer corner. This creates a subtle upward direction while keeping the overall shape balanced.
Classic extensions work particularly well for this style because their weight and placement can be controlled with precision. The finished look remains natural while adding structure and definition to the eyes. It is also a great starting point for anyone trying lash extensions for the first time.
Professionals who want additional productivity support can explore 6 Powerful ChatGPT Prompts to Help Reduce Your Workload.
Use AI carefully during technical learning. Try solving the problem independently first. Then ask for an explanation when something remains unclear. That habit strengthens actual understanding rather than encouraging copy-and-paste learning.
9. DataCamp Free Chapter Access
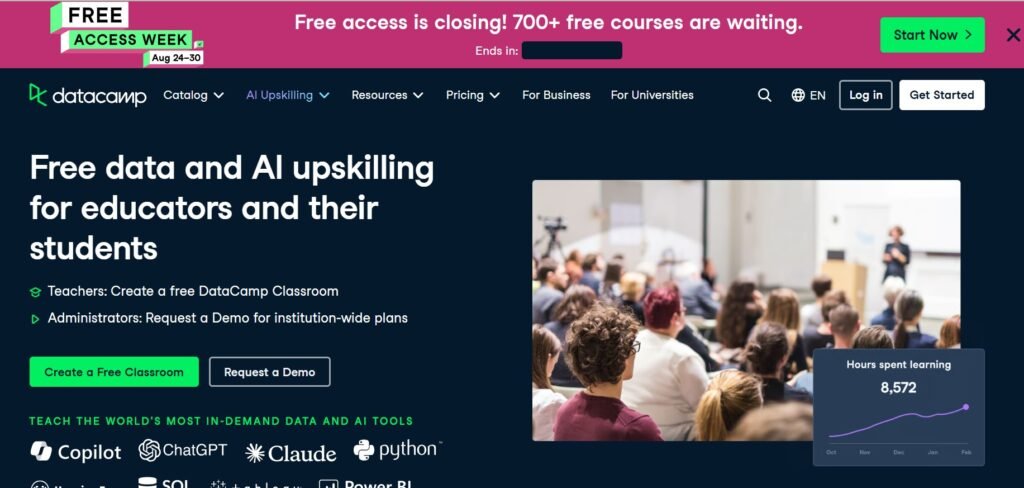
DataCamp offers beginner-friendly lessons covering tools such as Excel, Python, R, and data visualisation. The platform can help learners explore different analytical tools before committing to a specific workflow.
That flexibility can be useful because not everyone enjoys working with the same tools. One learner may prefer Excel, while another may enjoy Python. Someone else might find Power BI or another visualisation platform more appealing.
Start by exploring the basics of each tool and paying attention to which tasks feel most natural. From there, you can choose a practical direction and focus your learning on the skills that align with your interests and goals.
DataCamp also introduces common terminology used in data-related careers. Becoming familiar with these terms can make job descriptions easier to understand as you begin exploring potential roles.
Keep in mind that the free material may offer a more limited selection than paid access. Check the current availability before building your entire learning plan around the platform.
For professionals interested in building online income around several digital capabilities, 25 FREE Platforms to Learn Skills That Pay in 2026 offers more learning options. The key is to turn every lesson into practice.
10. Alison
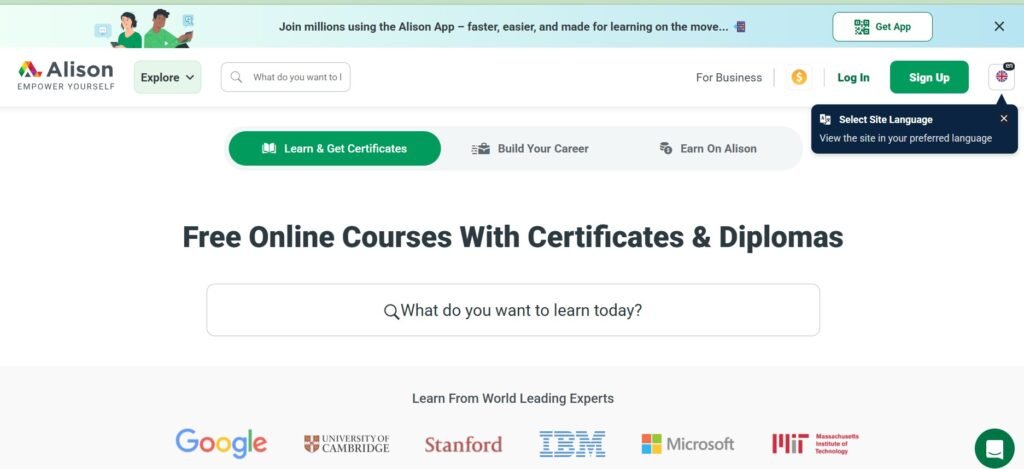
Alison offers free courses across various professional subjects, including data-related topics, Excel, business intelligence, and analytical fundamentals.
The platform can suit learners who prefer shorter lessons and clearly organised modules. Excel-based lessons can provide a practical introduction to working with data, while Power BI material can help learners develop dashboard and visualisation skills. Data-focused courses can also introduce common analytical concepts and terminology.
Certification options and pricing may vary, so check the current course page before assuming that a certificate is available at no cost. However, the greater value often comes from developing practical skills rather than collecting certificates.
A certificate can strengthen a résumé, but a working portfolio gives potential employers clearer evidence of what you can actually do. After completing an Excel module, create a small spreadsheet project using a real or sample dataset. Once you study visualisation, build a simple dashboard to apply what you have learned.
You can take the same approach with data-cleaning concepts by analysing a dataset and documenting the steps you used. This progression turns passive learning into practical experience and gives you projects you can continue improving over time.
Anyone preparing to enter the job market can also review 10 Things You Must Do Immediately After Applying for a Job for guidance on improving the application process.
11. edX Free Audit Options
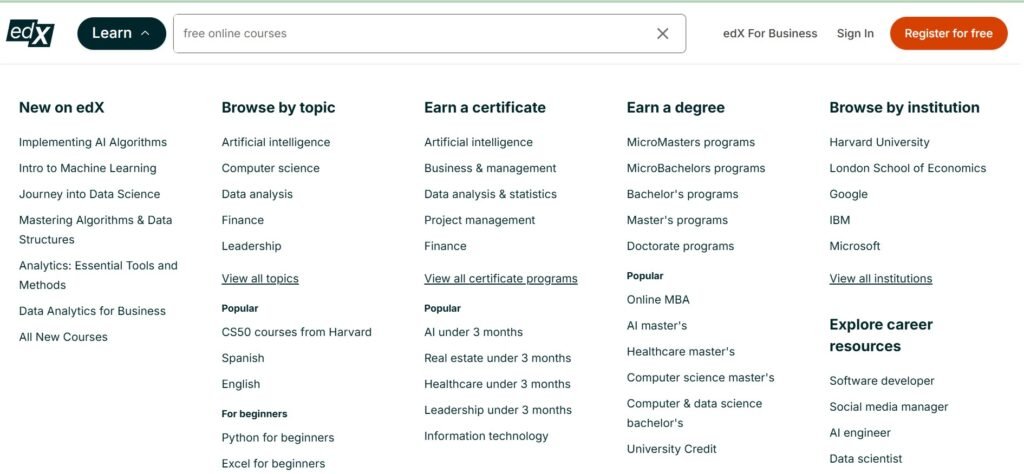
edX offers courses from universities and institutions covering statistics, Python, business analytics, and other data-related subjects. Some courses may provide access to learning materials through an audit option, while certificates and graded features may require payment. Always check the specific enrollment terms before signing up.
One advantage of edX is the academic depth available across many courses. Statistics courses can strengthen analytical reasoning, while Python courses can help build programming confidence. Business analytics courses can also show how organisations use data to support decisions.
Together, these subjects can give learners a stronger understanding of both the technical and practical sides of analytics. You can also compare different courses before choosing a long-term learning path.
However, avoid enrolling in everything at once. Choose one course, complete the required work, and build a project around what you have learned. Once you have finished, you can evaluate your progress and decide what to study next.
People exploring freelance and digital career options can also browse 100 Hobbies That Will Turn Your Time Into Money for ways to connect interests with practical services.
12. YouTube for Strategic Learning
YouTube can become one of the most useful free resources for data analysis when the search strategy stays focused. The problem starts when learners watch random tutorials without a plan. Instead, search for specific topics. Try phrases such as: “Excel data analysis project.” “SQL beginner project.” “Power BI dashboard tutorial.” “Python pandas data analysis.” “Data cleaning project for beginners.”
Choose creators who demonstrate complete workflows. The best tutorials show datasets, calculations, errors, corrections, visualizations, and project explanations. Watching someone build a complete project can help bridge the gap between theory and practice. YouTube also works well for reviewing concepts that feel confusing after a formal lesson.
The goal involves using video as a supplement rather than the entire learning system. Professionals exploring creative digital work can also see 7 Websites to Start Learning Video Editing for FREE and compare how practical project-based learning works across different skills.
A Simple 30-Day Learning Routine
A structured routine can make free learning much easier to manage.
Days 1–7: Build Excel Foundations. Spend the first week learning formulas, formatting, filters, sorting, and basic charts. Practice each concept immediately. Create a simple dataset. Then calculate totals, averages, percentages, and changes. Avoid moving forward until the core formulas feel comfortable.
Days 8–14: Learn Pivot Tables and Visualization. The second week can focus on pivot tables, charts, conditional formatting, and simple reporting. Take the dataset created earlier. Group the information. Compare categories. Identify trends. Then build a small dashboard. The dashboard does not need advanced design. It needs to communicate useful information clearly.
Days 15–21: Practice With Real Datasets. Kaggle can provide datasets suitable for beginner projects. Download one dataset. Inspect every column. Identify missing values. Remove obvious duplicates. Check inconsistent formats. Then write several questions that the data can answer. This step turns a spreadsheet exercise into an analytical project. ###
Days 22–30: Build One Portfolio Project. Choose a practical subject. Sales analysis works well. Customer survey analysis also provides useful practice. A trend report can work for content, marketing, or business data. Structure the project around a real question. For example: Which product category generates the highest revenue?
Which month shows the strongest growth? What customer segment appears most active? Which factors correlate with better results? The final report should explain the findings in simple language. People exploring additional tech-learning options can also check 10 Websites to Start Learning Graphic Designs for FREE and build complementary digital confidence.
Build a Portfolio Without Waiting for a Job
A common mistake involves waiting for professional experience before creating evidence of ability. A portfolio can start with public datasets. Use Kaggle data. Create a sales dashboard. Analyze customer feedback. Build a simple expense report. Study social media engagement. Compare product performance. Label every project honestly.
A practice project should remain a practice project. A real client project should reflect real work. That distinction protects credibility. AI tools can help brainstorm questions or explain technical concepts, but the final analysis should reflect genuine understanding. A growing portfolio can also support direct outreach through 8 SMART Ways to Find Clients on X (Twitter) and Get Hired FAST.
Learn the Skills Employers Actually Mention
Job descriptions provide useful clues about what companies expect. Look for repeated requirements such as: Excel. SQL. Power BI. Tableau. Python. Data cleaning. Reporting. Dashboards. Communication. Problem-solving.
These requirements can guide the learning plan. There is little value in spending months learning a tool that rarely appears in the roles being targeted. A smart learning plan follows the market while still considering personal strengths. A broader job-search strategy can also benefit from 9 FREE AI Tools Every Remote Worker Should Have in 2026. AI can assist with repetitive analysis tasks, but analytical judgment remains important.
How to Turn Data Analysis Into a Career Skill
A learner can eventually move toward several roles. Data analyst represents the obvious path. Business analyst offers another option. Marketing analytics can suit people interested in campaigns and customer behavior. Operations analytics can focus on processes and efficiency. Financial analysis can involve budgets and business performance. Reporting roles can focus heavily on dashboards and recurring reports. Some professionals also combine analysis with another skill.
For example, marketing plus analytics can create a useful specialization. Customer service plus analytics can support customer experience teams. Finance plus analytics can strengthen reporting and forecasting work. The combination can create stronger positioning.
Improve the Résumé After Building Real Evidence
The CV should reflect genuine projects and measurable outcomes. A practice project can appear under a projects section. For example: Sales Performance Dashboard, Personal Project. Analyzed a multi-month sales dataset using Excel.
Cleaned inconsistent records and organized product categories. Created pivot tables to compare revenue by product and month. Built a dashboard highlighting major sales trends. That description communicates actual work.
Avoid inventing percentages or business outcomes. Use only numbers that the underlying dataset supports. Professionals can also use 10 Powerful Chat GPT Prompts to Help You Rewrite Your Resume to improve wording without inventing qualifications.
Strengthen the LinkedIn Profile
A strong LinkedIn profile should communicate the direction clearly. A headline might mention data analysis, Excel, SQL, or Power BI. The About section can explain the problems the professional enjoys solving. The Featured section can showcase portfolio projects. The Skills section should match the actual abilities.
The profile should also remain consistent with the résumé. For additional guidance, How to Optimize Your LinkedIn Profile Using ChatGPT can help improve profile positioning. A clear profile can make networking conversations easier.
Keep Developing Communication Skills
Data analysts do more than calculate numbers. They explain finding, prepare reports. present recommendations and answer questions from nontechnical colleagues. That means communication matters.
A technically correct report can still fail if nobody understands the conclusion. Practice writing short explanations. State the finding first. Add the supporting evidence. Then explain why the result matters. The same principle applies during interviews.
Prepare to explain one project in simple language. Describe the problem. Explain the process. Share the result. Then discuss what the organization could do next. Professionals can also strengthen communication through 6 ChatGPT Prompts to Transform Your Writing in 60 Seconds when drafting practice summaries and explanations.
Use AI as a Learning Assistant
AI can support data learning in several ways. Ask for an explanation of a confusing SQL query. Request examples of spreadsheet formulas. Ask for practice questions. Generate sample datasets for exercises. Request feedback on a written project summary. However, avoid copying complete solutions without understanding them.
The point of learning involves developing the ability to solve problems independently. AI should accelerate learning rather than replace it. Professionals interested in broader AI education can explore 10 FREE AI Courses With Certificates You Should Take Today. That knowledge can later become useful when automating repetitive analysis tasks.
Turn Data Analysis Into Freelance Services
Data skills can also support freelance work. Small businesses often need help cleaning spreadsheets, organizing records, creating reports, and building dashboards. A freelancer could offer services such as: Excel cleanup. Monthly reporting. Dashboard creation. Survey analysis. Data organization. Basic business reporting.
The offer should remain specific. “Data analyst available for anything” sounds vague. “Monthly sales dashboard and reporting for small businesses” communicates a clearer service. The same principle applies to other freelance services. How to Make Your Current Skill More Valuable and Make Money Without Learning a New One can help with positioning an existing ability around a specific business problem.
Final Thoughts
Learning data analysis does not require an expensive classroom or a massive budget. The resources above can provide enough material to build a strong foundation. Kaggle supports hands-on practice. freeCodeCamp develops technical skills. Coursera can provide a structured Google pathway. Microsoft Learn supports Excel and Power BI. Harvard strengthens statistical foundations.
MIT adds deeper academic knowledge. Khan Academy makes mathematics easier to approach. Codecademy offers interactive coding practice. DataCamp provides beginner-friendly exposure to several tools. Alison offers additional professional learning. edX adds university-level options. YouTube provides flexible tutorials and project demonstrations. The best path involves using these resources strategically.
Choose one starting point. Build a foundation. Practice with real data. Create projects. Document the findings. Then continue adding skills such as SQL, Python, Power BI, or advanced Excel.
A career does not emerge from course completion alone. It grows through applied knowledge, consistent practice, communication, and evidence. A learner who can explain what the data means becomes more valuable than someone who simply knows where to click.
That distinction matters in interviews, freelance work, and professional environments. As progress develops, keep improving the wider career system. Use 10 websites to learn data entry for FREE with certificates for related spreadsheet practice. Explore 12 Websites to Start Learning Project Management for FREE when coordination skills become relevant. Job applications can also improve through better supporting documents.
How to Write Your Cover Letter Using ChatGPT can help structure a focused letter around real experience. Finally, remember the most important principle. Learning creates potential. Practice creates ability. Projects create proof. Results create credibility. That progression can turn free online resources into a serious foundation for a data-focused career.